
What is this all about?
This morning, my watch is telling me to go for a 1:10 'long run' at a moderate pace. I'm currently coming off a viral infection, which I suspect was COVID. Immediately before the infection I was on a taper for a marathon, so I was in pretty good shape and a 1:10 run was nothing. I started with the virus on 11th April and felt terrible all day, then had a false recovery for the next two days before round two. A week later, on the 18th, I still felt 'virusy' but shortly after I started to feel like I was recovering rather than actively still fighting the infection.
It's now 4th May and I haven't run since 10th April. I'm doing dog walks, but that's about the limit of my cardiovascular abilities at the moment. I've twice tried a 15 minute bike session at <50% heart rate and the next morning saw a spike in resting heart rate and a crash in heart rate variability.
My watch tracks my activity, resting heart rate, heart rate variability, and determines training readiness and suggested workouts by some algorithm that supposedly considers all the data is records. Any idiot looking at the charts Garmin generates could tell that a 70 minute run is a recipe for disaster, even without explicitly knowing I've had a virus. The question is: can I take the same data and do better?
Thus begins my foray into the world of tracking and managing recovery.
What do elites do?
Firstly, a quick definition: When I say "virus", I'm referring to a significant viral infection like flu or COVID that causes ongoing fatigue and training effects well after the viral symptoms have resolved. I'm not talking about a mild common cold that you recover from in a few days.
I first wondered how elite athletes handle this kind of situation. There is a balance between wanting to get back to training but also mitigating the risks of long covid of post viral fatigue, which increase substantially by pushing too hard too soon. Compared to the average person, elites have both more drive and reason to get back to training quickly, and more risk of pushing too hard too soon and hurting their performance and career. This is an optimisation problem, and, in theory, elite teams' doctors should have solved it.
The answer is that elites track their status through subjective and objective metrics, most of which are available to the ordinary person with a decent sports watch:
- Pre training daily readiness:
- Resting Heart Rate (RHR) measurements
- Heart Rate Variability (HRV) measurements
- Possibly Oxygen Saturation (SpO₂) measurements if undue breathlessness has been noted
- Subjective "how do I feel?" self assessment, considering sleep, mood, fatigue, aches/soreness, etc.
- During and after training:
- Perceived exertion vs actual workload
- Proportionality of heart rate during and after exercise with respect to the workload
- Medical screening
- Blood tests for various things, e.g. inflammation markers, ferritin, haemoglobin, vitamin D, etc.
- Cardiac screening if symptoms were moderate/severe.
The average person may or may not have access to the medical screening, depending on their quality of healthcare, but they do have access to all of the other things, though of course the subjective self assessment requires self awareness and discipline.
Most elite programs follow a staged approach to returning to training:
| Stage | Activity |
|---|---|
| 0. Initial recovery | Wait at least 10 days after infection, including 7 days symptom free. |
| 1. Light movement | Walking, mobility |
| 2. Easy aerobic work | Low intensity, short duration |
| 2.5 Resistance training | Reintroduce very light resistance training (low/no weights, reduced reps and sets) |
| 3. Moderate aerobic work | Longer but still controlled intensity, progress resistance training |
| 4. Introduce intensity | Short intervals, progress resistance training |
| 5. Full training | Return to normal training load and intensity |
Where each stage lasts at least 24 hours and progression only occurs if there is no negative response in the readiness metrics the following day.
It's worth pointing out HRV specifically. HRV is often suppressed for weeks or even months following a virus. In this case, the aim is to keep a stable or improving HRV, not to reach the previous readings. HRV is considered alongside subjective markers; a low but stable HRV alongside feeling good isn't a blocker. A volatile HRV that reacts badly to mild exercise is a blocker. Furthermore, it must be considered that HRV and RHR will be adversely affected by deconditioning, and that mild exercise may help them improve. It's not a black or white interpretation. There is less a focus on waiting for HRV to reach pre-viral levels before resuming training, and more a focus on "at what level am I able to train without making my stats worse?"
After a virus it's expected that it'll take two weeks to get from stage 1 through to full training in the very best case, with 5-6 weeks being very possible. So it is a conservative and slow process where you don't just shrug off a bad result and push through. It's likely an awful lot more conservative than the average amateur runner would tolerate, which is notable.
Results
With this in mind, I've tried to create a model that gives me a vague indication of my recovery status using objective metrics. The model takes as input the data listed below, and gives as output a readiness indicator in the span 'GOOD', 'CAUTION_MINOR', 'CAUTION', and 'DANGER', which roughly correspond to "Go ahead", "Go ahead but beware of this...", "Maybe don't do a hard session today" and "Rest today".
Then I've transformed this into a dashboard, with a summary of what the stats look like today and a set of charts showing the trends of the things I'm interested in. There is much room for improvement - see the discussion at the end of the article. This is what it looks like on a good day:
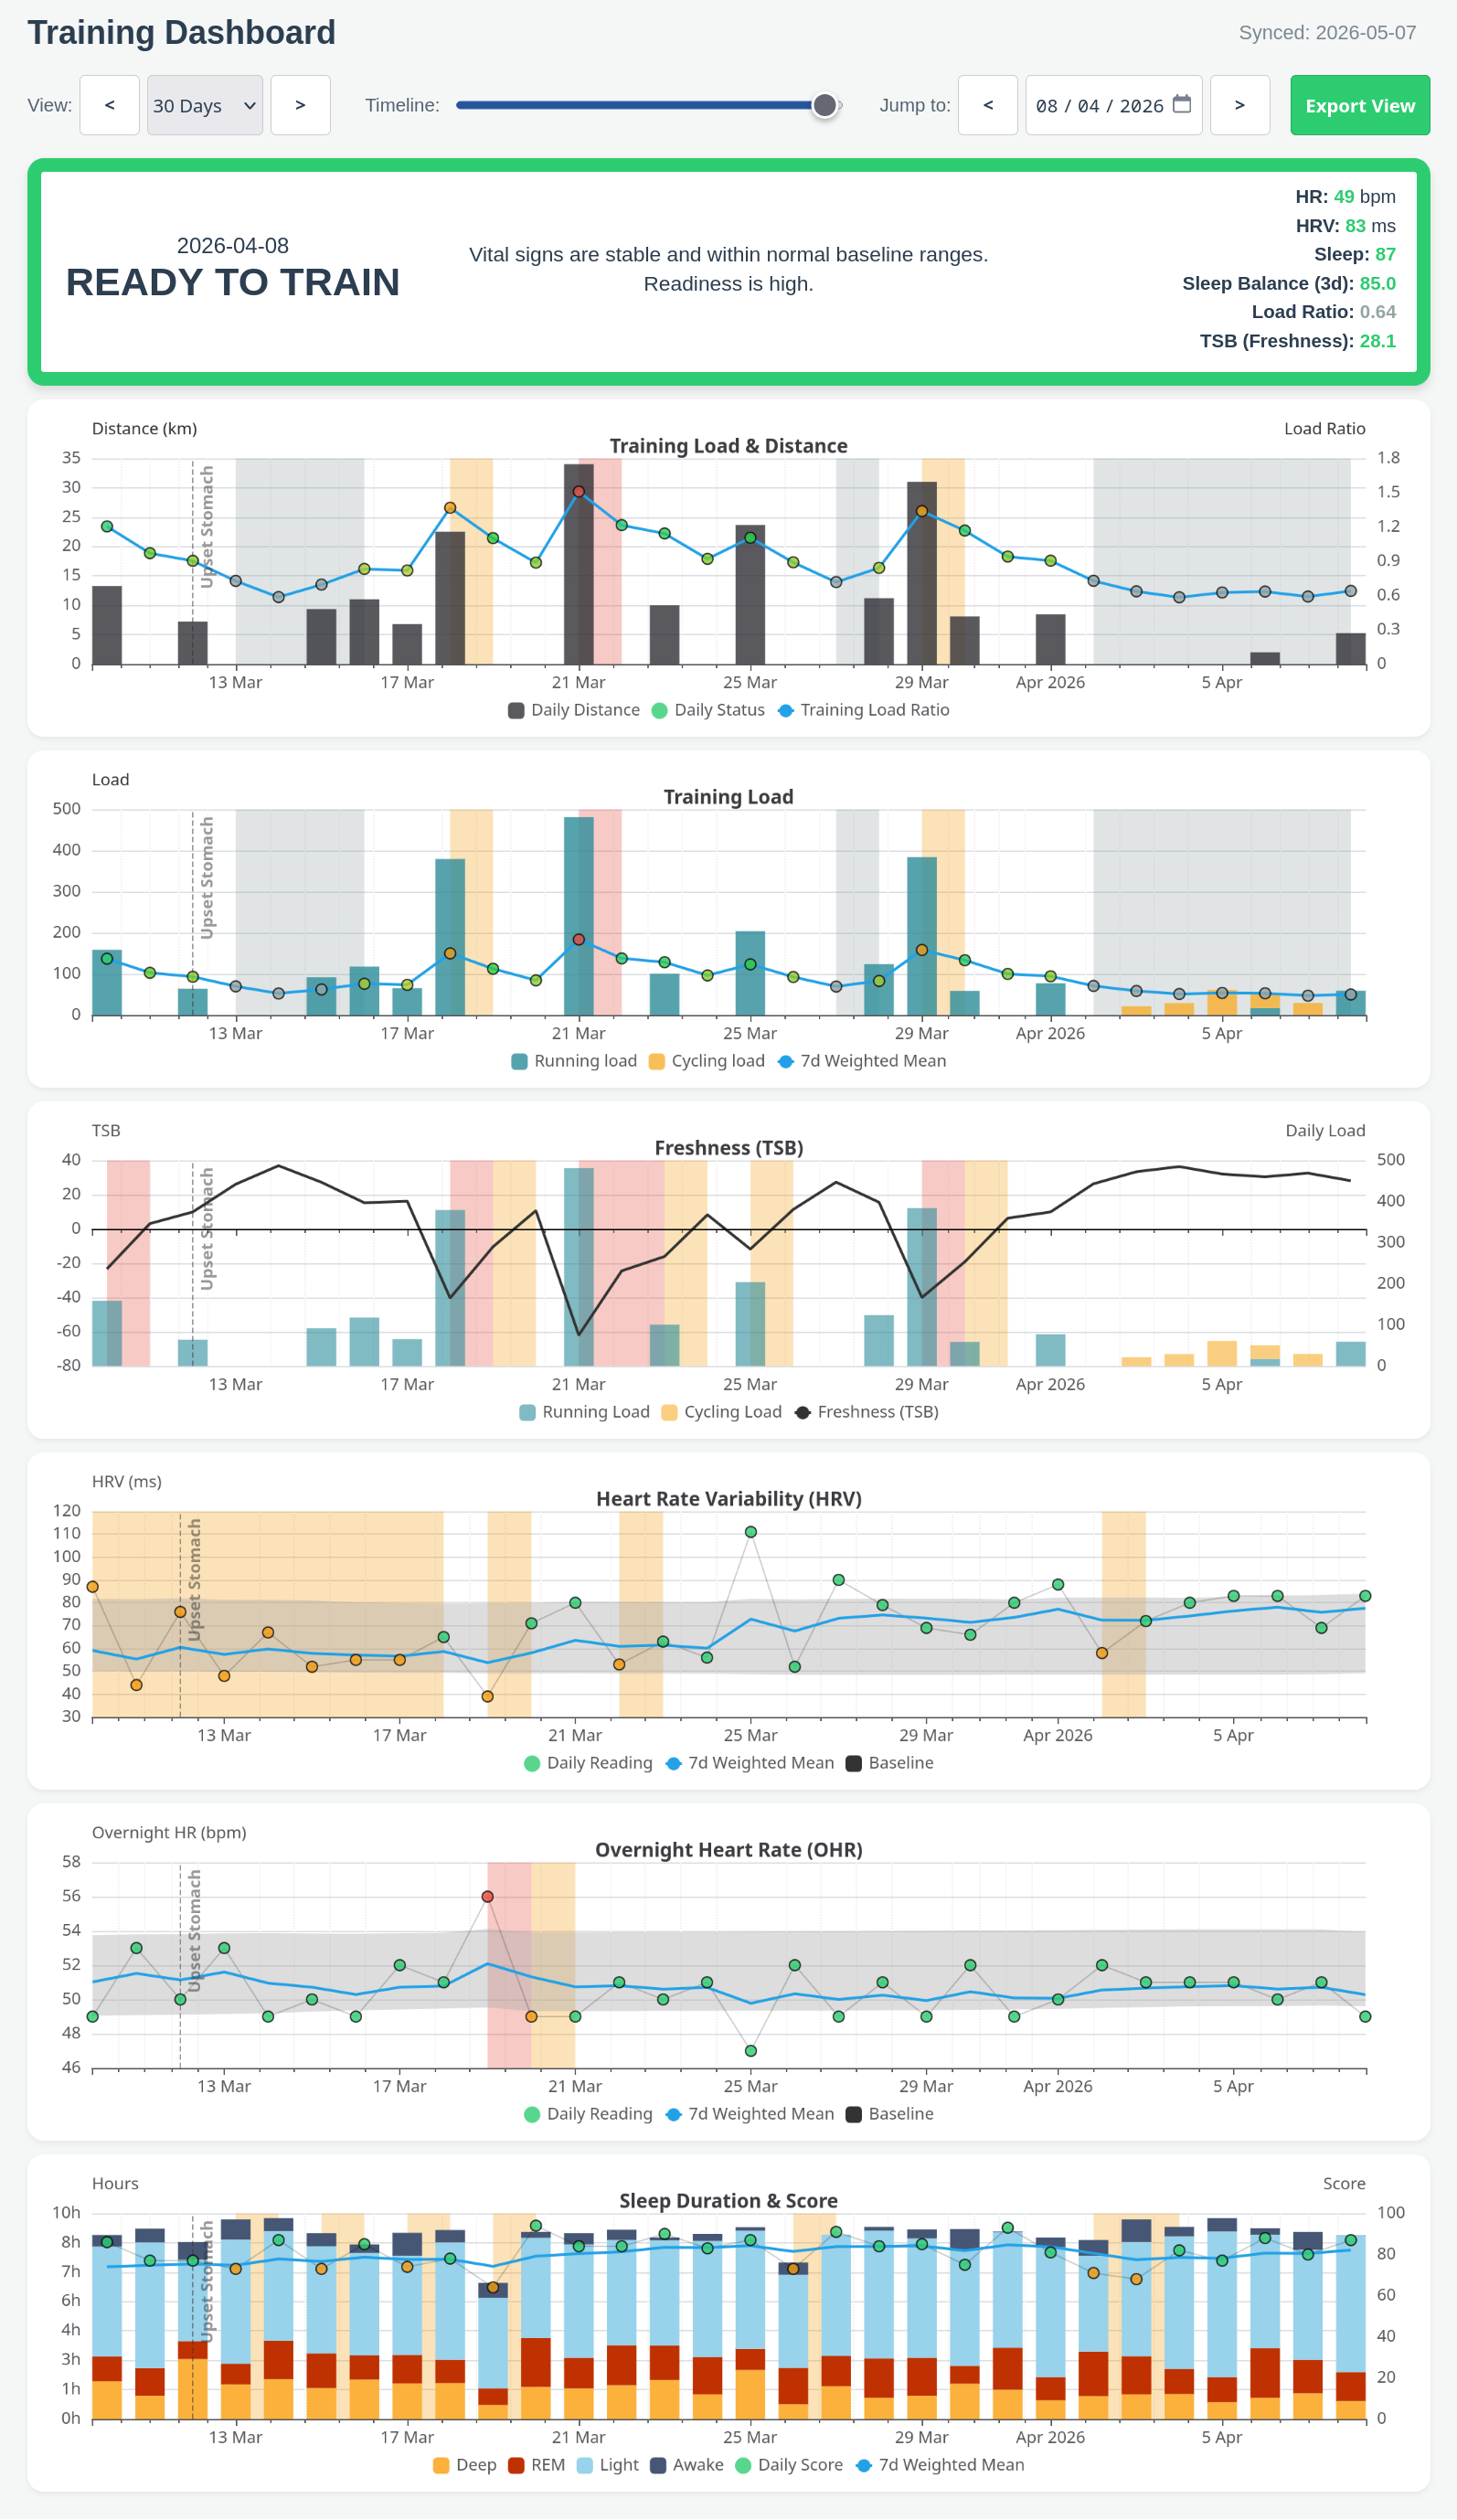
The summary status is versatile. Good days, intermediate days and terrible days can look something like this:
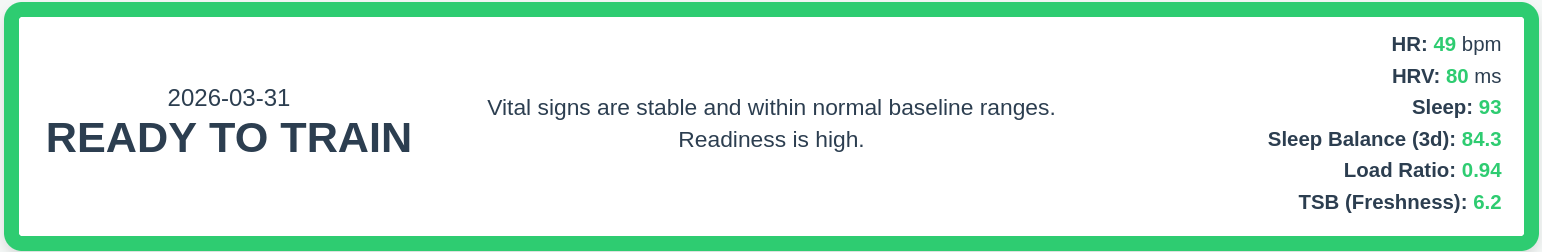
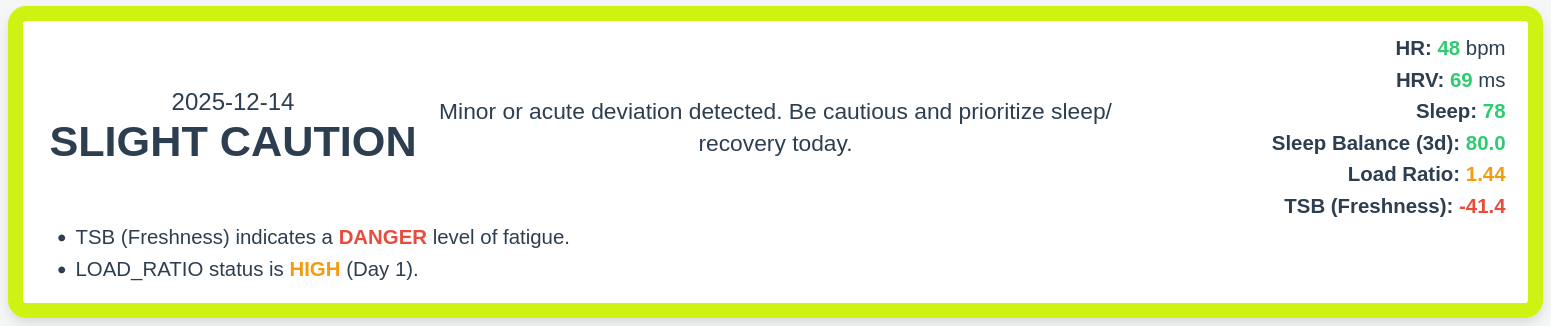
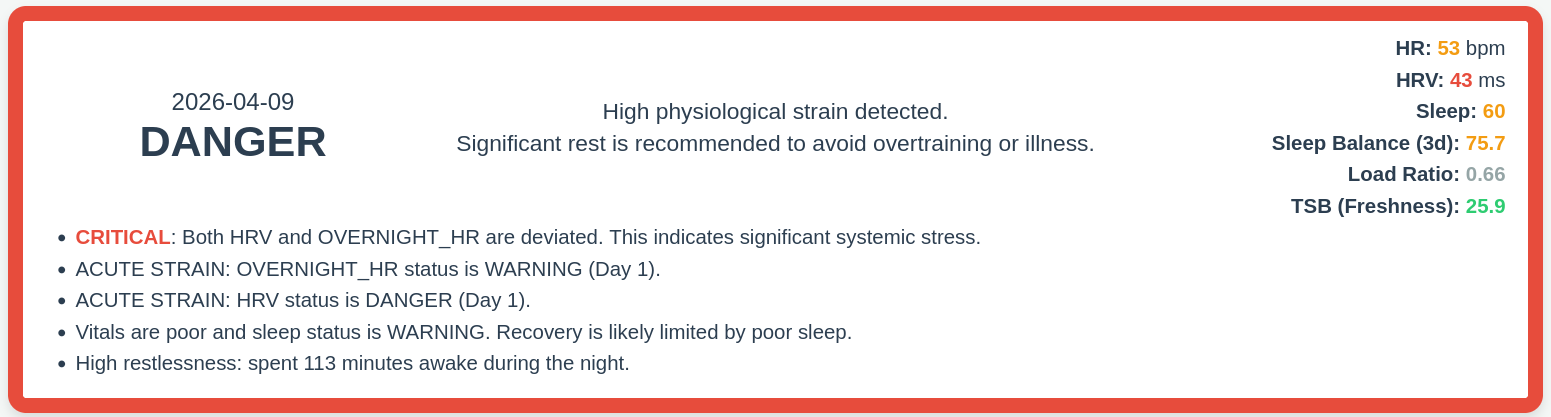
The status messaging needs a bit of refinement still, but you can see the general idea.
The model
The inputs
The data considered are:
- Resting heart rate or overnight heart rate. I have some discussion on this below.
- Heart rate variability.
- Training load. Garmin has its own calculation for this, but I've ignored it and used a modified TRIMP calculation which I feel more accurately reflects the relationship between load and session duration, i.e. that a two hour session is more than twice as demanding as a one hour session.
- Sleep quality, which I haven't assigned great significance to, but it is used to flag warnings if it is unusually poor overnight or dips for a few days, and e.g. it is considered in the context of possible markers of illness if training load is low and sleep is good but recovery is bad.
RHR vs Overnight HR
Garmin's resting heart rate measurement is the lowest 30 minute average heart rate recorded over a 24 hour period. This isn't technically the definition of resting heart rate, but that's not necessarily a problem for a metric. But it does have numerous caveats. When I look at my data, the RHR is essentially an outlier in the 24 hour period, so if it rises, what does that really mean? That I didn't hit the outlier today? But does look like a reliable reading - it doesn't change much day to day in my history, and when it does change it looks like a valid marker of fatigue or illness. More a problem is that the 24 hour period is midnight to midnight: it's not unusual for my morning reading to be significantly higher than average to the point of being worrying, but then find the next day it's been adjusted downwards because it came down in the late evening while I was asleep. This might be because HR is lowest in deep sleep and deep sleep tends to occur earlier in the night, which for me is before midnight, i.e. at the very end of the 24 hour period.
This is a problem because my model when considering today's RHR reading does so in the context of historical RHR data, but the historical RHR was taken during deep sleep, and for today, I might not yet have had any deep sleep. So the morning reading is not really comparable to historical readings.
Since late last year Garmin has also started recording average overnight heart rate, which sounds like it should be better because it is final at the point that I wake up.
I use one of these as the source of truth for heart rate data and I keep going back and forward on which one is better. In reality, I find the RHR measure probably has a little more value when looking back through my history, but less value for today. As I'm primarily interested in using this to assess what state I'm in today as a training decision influence, the overnight reading is winning.
The techniques are roughly as follows:
1. Establish a "normal" rolling baseline for HR and HRV
The algorithm starts by determining a 'normal' range for my readings using a 28-day rolling window. This baseline range is determined using the mean and standard deviation over the window.
2. Measure deviation (Z-Scores)
To decide if a specific day is an outlier, the system uses two Z-Scores (which measure how many standard deviations a value is from the mean):
Local Z-Score: Compares today's value against the baseline. This identifies how I'm doing are doing relative to my recent self. Delta Z-Score: Compares the change between yesterday and today against typical daily fluctuations. This detects sudden shocks like an illness, even if the absolute value hasn't left the normal range yet. The velocity of change is probably the most visually obvious marker of illness when looking at the charts by eye (even before symptoms develop), so this is important.
3. Determine metrics' daily status (the fun part)
The metric status algorithm is a state machine that looks at today's metric and the preceding days if necessary. The possible statuses are "GOOD", "WARNING" and "DANGER". WARNING and DANGER are considered 'alarm' statuses.
An alarm is triggered if the Z-score or Delta Z-score crosses a threshold. Recovering requires going back into the recovery baseline (see below) and staying there. It's easy to go into an alarm status. It's slightly less easy to exit the alarm status, and it becomes harder and requires a longer cooldown the longer the alarm status persists. This means you can't be ill for two weeks then suddenly jump back to healthy just because your numbers improve for a day, you have to stay in the WARNING state for a few days to check the metric is stable.
Recovery baseline: At the point that we enter the DANGER status, the algorithm goes back in time to the most recent GOOD period and pins that period's baseline as the recovery baseline. This captures the healthy average from before the crash and prevents the target recovery baseline data from immediately being poisoned by data from an unhealthy period. However, as I've noted, HRV can be suppressed following a virus and this isn't necessarily a problem by itself as long as you're recovering well and feel well. So instead of pinning the recovery baseline indefinitely, which could lead to being out of the baseline for years, after two weeks of being in an alarm state the baseline is calculated as a blend of the true statistical baseline and the recovery baseline over a period of two weeks (after which point the baseline is the true statistical baseline).
4. Watch for overreactions to training load
One of the things I really wanted the model to detect is an overreaction in HRV or RHR to normal training loads. For example, in my current recovery, I've twice tried a very gentle 15 minute bike session at <50% HR which barely registers as training load at all, but then saw my RHR spike and my HRV crash the next morning. This kind of overreaction is significant. In the staged return approach above, it means stop what you're doing and go back a stage.
This is done using a linear regression model to compare the metrics' reactions to a given training load with the 'expected' reaction within the dataset.
5. Other bits and pieces
We calculate a bunch of other stuff to do with training load, like the acute to chronic load ratio and the total stress balance. This is fairly normal basic sports science stuff that you can read about elsewhere. It's used to warn when the training load has increased more rapidly than is safe.
Things I want to improve
The original observation that led me here was that Garmin's daily workout suggestions were silly. I'm not actually tackling suggestions, but it would be nice for completeness to use the readiness and recent training history to suggest a daily exercise session or rest. The readiness indicator is a good basis for this, but to actually come up with an appropriate session needs more understanding of recent training history than the model currently has. In theory it's not a difficult problem, it just requires more detailed analysis of activities to determine what a good recent benchmark for an easy or hard session is. But I could only do this for running; my cycling data is very limited because I use a very old school exercise bike which doesn't support speed, distance or power, so all I have are heart rate and duration.
Secondly, I'm coming around to the idea that the most important metric is "how do I feel?", which my watch can't record automatically. As I've been unwell and am looking forwards towards recovery, I've been trying to use RHR and HRV as proxies for this with predictive power. I think it's correct to observe RHR, as it tends to be sensitive to infections and rebounds quickly, but HRV can remain suppressed for some time without other symptoms. At this point, HRV is one of multiple metrics, and is more usefully observed in the context of subjective feeling. My dashboard uses data recorded by Garmin only, but it would be useful to track daily subjective readiness, mood, fatigue, training RPE vs workload etc and consider that as context for interpreting the RHR/HRV metrics. For example, a few days of feeling down and struggling with workouts and then HRV dips? That's interesting. Otherwise, the model can't really interpret the significance of that HRV reading. But of course, recording the subjective metrics means my model has to prompt for data rather than just pulling it off Garmin, which adds substantial complexity to the implementation and makes it more of an active process for the user.
Thirdly, the TRIMP based training load calculation is a bit rubbish because it's essentially only considering average heart rate and duration and therefore can't distinguish between 1. an interval session with standing recoveries where the HR oscillates far above and below the average and 2. a moderately paced run of the same duration where the HR sits close to the average most of the time, where the former is a higher load than the latter by any useful metric. I'd like to improve this, but, again, it would involve a more detailed analysis of the activities, and, again, would be limited for cycling.
The technical side
I pull data from Garmin's APIs daily.
This goes into a Python program where a lot of the statistical modelling magic happens, using Pandas. It then generates a JSON file containing daily history for the dataset.
The JSON file is loaded into the HTML dashboard, which generates charts and does the interpretation of the daily data and turns it into a readiness indicator with a set of reasons/warnings for things that have fed into the decision to return anything less than "good". There is a bit of overlap between the JavaScript and Python, which is difficult to work out fully; Python/Pandas is really good for statistics and data analysis, but having some of the calculations in JavaScript makes it easier to scroll through different time periods and get a full analysis for any given day, which helped me assess how well the model has worked historically.